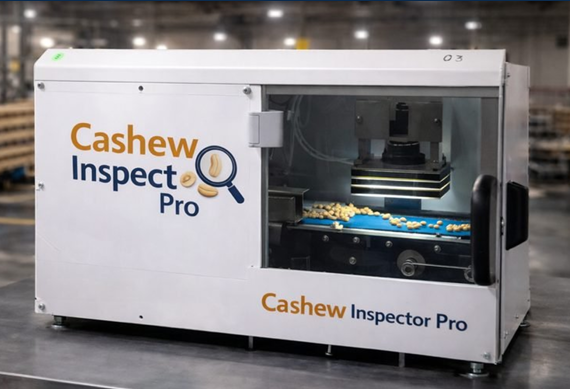
The Cashew Kernel Grading Challenge
The cashew sector reached USD 9.9 billion in 2025 with forecasted expansion to USD 14.64 billion by 2031. India and Vietnam dominate processing, with India handling 36.5% of global supply. The industry depends heavily on manual labor for kernel classification — a bottleneck cited by over half of processors as their primary operational challenge.
Cashew kernels fall into 33 export grades based on size, shape, color, and integrity. Premium grades like W180 command 20–30% price premiums compared to lower tiers. Misclassification diminishes margins significantly in both directions.
| Failure Mode | Downstream Consequence | Commercial/Regulatory Risk |
|---|---|---|
| Grade misclassification | Price realized below true value | Revenue loss per metric ton; buyer disputes |
| Black spot/mould accepted | Food safety rejection at port | EU/FDA non-compliance; lot destruction |
| Shell fragments in pack | Consumer injury risk; recall event | FSSAI/APEDA withdrawal; brand damage |
| Scorched mixed into white grade | Colour downgrade of entire lot | Retailer penalty; re-sort cost |
| Shrivelled kernels passed | Texture/taste failure in product | Customer return; contract cancellation |
Why Manual Grading Falls Short
Skilled graders inspect approximately 150–200 kernels per minute under optimal conditions — far below automated capacity. The 33-grade taxonomy exceeds human cognitive consistency, causing drift between operators and shifts. Fatigue increases defect miss rates by 20–30% over extended shifts.
| Manual Method | Capability Limitation | Operational Impact |
|---|---|---|
| Visual colour grading | Subjective; reference card dependent | White/Scorched/Desert boundaries inconsistent |
| Hand sorting (whole vs split) | Fatigue-driven miss rate; slow throughput | Cannot sustain high-speed line parity |
| Manual defect inspection | Inspector fatigue after 60–90 min | Defect miss rate rises 20–30% over shift |
| Mechanical sieve grading | Size-only; no colour or defect detection | Scorched/black-spot kernels pass through |
| Sample-based QC checks | Lot-level not kernel-level confidence | Export rejections from undetected clusters |
Three-Station Machine Vision Approach
Station 01 (Morphometric Sort) uses diffuse white LED dome imaging with area-scan cameras capturing top and side views. Algorithms extract length, width, area, perimeter, aspect ratio, and convexity to classify kernels as Whole, Split, Butt, or Piece within size brackets W180–W450. BPNN classifiers demonstrate 96.8% accuracy on grade assignment.
Station 02 (Multi-Channel Colour Grading) uses White LED and UV fluorescence to illuminate kernels simultaneously across RGB and UV spectra, discriminating White, Scorched, and Desert grades. UV excitation identifies aflatoxin-producing mold contamination absent under standard light. Station 03 (Deep Learning Grading & Traceability) uses YOLOv5 achieving 97.65% classification accuracy with inference time of 0.025 seconds per image, enabling inline operation.
| Defect/Attribute | Sensing Modality | Indicative Accuracy |
|---|---|---|
| Whole vs Split/Butt/Piece | RGB morphometric | ~97–99% |
| W-grade sizing (W180→W450) | RGB area-scan | ~96–98% |
| Black spots/mould stain | RGB + UV fluorescence | ~95–98% |
| White/Scorched/Desert grade | RGB HSV colour | ~96–99% |
| Shell/husk fragments | RGB texture + shape | ~97%+ |
| Shrivelled/heat-damaged | RGB morphometric | ~95–97% |
| Aflatoxin mould (UV screen) | UV fluorescence | Screening indicator |
Expected Outcomes & ROI
W180 kernels command 20–30% higher prices than W320 grades. For a facility processing 500 metric tons monthly, improving W180/W210 accuracy from 80% to 97% recovery yields USD 40,000–80,000 monthly in previously misclassified premium product.
| Outcome Area | Indicative Improvement | Business Driver |
|---|---|---|
| Grade classification accuracy | Manual ~70–85% → AI >97% | Capture W180/W210 price premium fully |
| Inspection throughput | 5–10× manual capacity | Enable inline 100% inspection at line speed |
| Labour cost reduction | 3–5 FTE graders per shift | Payback period typically 18–30 months |
| Export rejection rate | Reduce defect pass-through >80% | Eliminate port rejection costs + rework |
| Lot traceability | Per-kernel image + grade log | AGMARK/FSSAI/APEDA compliance ready |
| UV mould screening | Continuous aflatoxin risk flag | Early warning before export QC failure |
Implementation Considerations
Phase 1 — Feasibility (4–8 Weeks): Representative lots spanning the processor's grade and variety spectrum undergo imaging and classification to establish baseline detection performance. This phase generates the training dataset and performance benchmarks for de-risking capital decisions.
Phase 2 — Production (2–4 Months): The production system runs alongside existing manual inspection, enabling cross-validation of AI decisions and model refinement specific to the facility's kernel varieties and processing conditions. Autonomous production typically launches within 2–4 months, with continuous improvement as datasets expand.
The full application note covers detailed system architecture, camera and lighting configuration parameters, model training methodology, integration with existing MES and ERP systems, and a step-by-step deployment checklist validated across multiple production sites.