The Inspection Challenge in Metal Bar Fabrication
The global metal fabrication market was valued at USD 26.85 billion in 2024 and is projected to reach USD 41.48 billion by 2033 at a CAGR of 4.85%. Manual inspection becomes a critical bottleneck as fabricators scale — it is subjective, slow, and unable to maintain consistent standards across shifts.
| Challenge | Operational Impact |
|---|---|
| Surface defects missed at intake | Defective bars enter production, causing downstream weld failures and rework at later stages |
| Off-centre or misaligned cuts | Joint fit-up errors that compromise weld quality and frame squareness during assembly |
| Weld porosity / incomplete fusion | Structural joints that fail load-bearing requirements, triggering costly remakes or failures in service |
| Angular deviation in frame assembly | Frames with out-of-square joints rejected at final inspection or passed to site |
| Inconsistent inspector judgment | Shift-to-shift variability produces uneven accept/reject rates and hidden quality risk |
| No data trail for quality audits | Inability to trace defect origins back to specific batches, operators, or process conditions |
Why Traditional Inspection Falls Short
Traditional NDT methods such as magnetic particle or dye-penetrant testing are effective but destructive to production flow — slow, chemical-intensive, and unsuitable for 100% in-line inspection at fabrication throughput rates. AI inspection systems detect 40–60% more defects than manual quality control methods; a human inspector can assess only 50 joints per hour versus several hundred for automated vision systems.
| Limitation | Consequence for Metal Fabrication |
|---|---|
| Human fatigue | Inspector accuracy degrades measurably over a shift, particularly on repetitive surface scans of reflective metal stock |
| Reflective surfaces | Polished or semi-polished metal bars produce glare and specular highlights that mask cracks and dents under ambient light |
| High inspection volumes | Cutting and welding lines produce parts faster than manual checking allows — 100% inspection is impossible without automation |
| No real-time feedback | Defects discovered at end-of-line cannot be traced to the specific weld pass or cut sequence |
| Standards compliance burden | ISO 3834 weld quality and ISO 9013 cutting tolerance requirements demand documented, repeatable measurement |
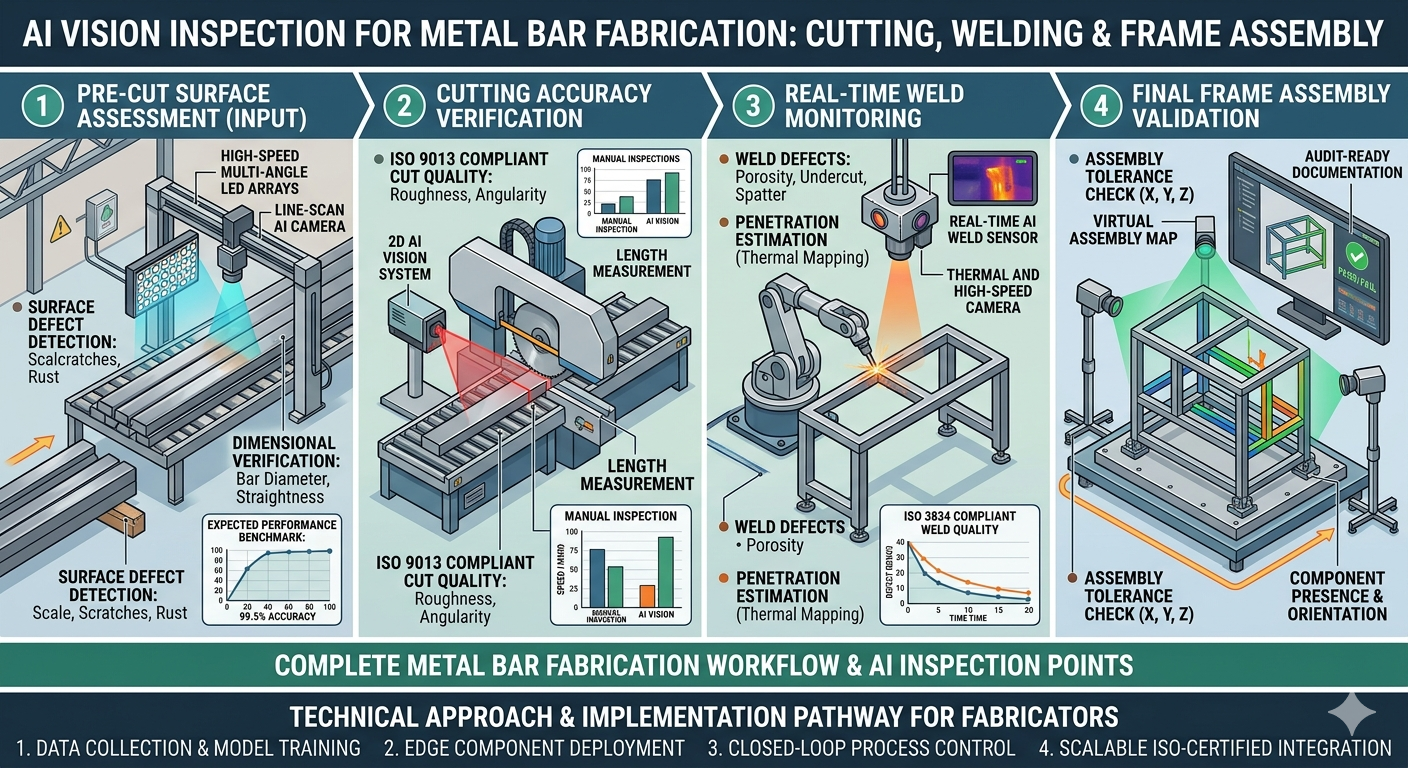
The Machine Vision Approach
Qualitas Technologies deploys a multi-station architecture covering the full fabrication workflow. Station 01 (Pre-Cutting Surface Inspection): High-resolution line-scan cameras with coaxial LED illumination image every bar prior to cutting. Coaxial lighting cancels specular reflections, making surface cracks, dents, and pitting visible. A CNN-based model classifies anomalies in under 5 ms.
Station 02 (Cutting Accuracy Verification): Area-scan cameras combined with laser triangulation measure cut offset, centre deviation, and edge quality against ISO 9013 tolerance class specifications. Stations 03 & 04 (Weld Inspection): The Keyence LJ-X8000 Series 2D/3D laser profiler captures 3,200 profile points per scan to measure bead height, width, throat thickness, and leg length in real time.
| Defect / Anomaly | Detection Method | Station |
|---|---|---|
| Surface cracks | Coaxial line-scan imaging at 4K resolution | Pre-cut surface station |
| Dents and deformation | Structured light 3D profiling | Pre-cut surface station |
| Cut offset / misalignment | Laser triangulation + area camera | Post-cut dimensional station |
| Weld porosity / spatter | Keyence LJ-X8000 3D laser profiler inline | In-process weld station |
| Weld cracks / undercut | Keyence LJ-X8000 + Qualitas AI classifier | Post-weld inspection station |
| Incomplete fusion / overlap | LJ-X8000 bead profile + DL defect model | Post-weld inspection station |
| Angular deviation / warping | 3D multi-camera angular measurement cell | Final frame assembly station |
Expected Outcomes & ROI
- Defect Detection Rate: 40–60% uplift vs manual inspection
- Weld Inspection Accuracy: Up to 99.5% classification accuracy on trained weld defect categories — porosity, undercut, cracks
- First-Pass Yield: ~20% improvement in first-pass yield, reducing frames requiring rework
- Rework Cost Reduction: 15–37% reduction in rework costs
- Inspection Throughput: 5–10× faster than manual checking; 100% inspection at production line speed
- ISO 3834 Weld Records: Every weld pass linked to thermal data, defect classifications, and operator ID
- ROI Payback Period: Typically 8–18 months; high-volume operations with frequent rework see payback as short as 6–8 months
Implementation Considerations
Phase 1 begins at the highest-risk station — the weld cell. Phase 2 adds pre-cut surface inspection and cutting accuracy verification, integrating output from all stations into a shared traceability layer. Phase 3 brings in final frame assembly angle checking. Each phase is implemented without halting production using shadow-mode operation.
Modern AI vision platforms support transfer learning and few-shot learning, enabling robust models to be trained from relatively small labelled datasets — typically 200–500 images per defect class — before being fine-tuned with production data. All inspection images are stored with metadata including batch number, timestamp, camera ID, and model version.
The full application note covers detailed system architecture, camera and lighting configuration parameters, model training methodology, integration with existing MES and ERP systems, and a step-by-step deployment checklist validated across multiple production sites.